Range Probabilities
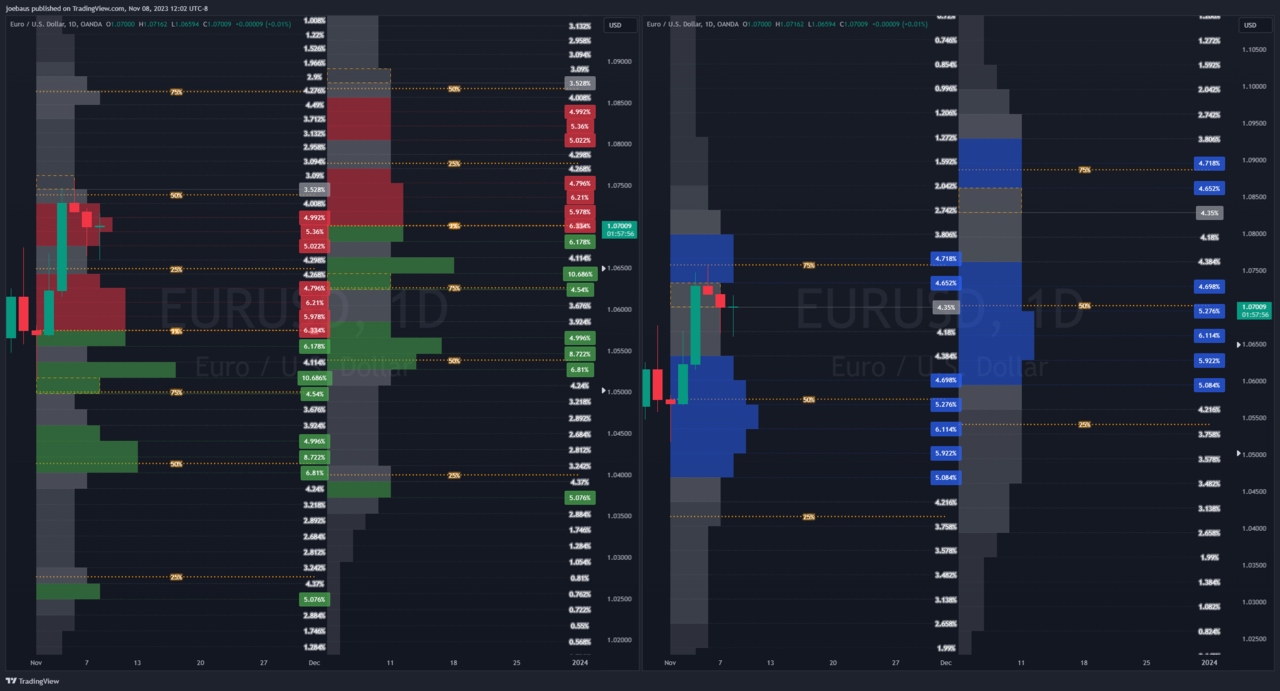
Load any OHLC data into the indicator and see its distribution drawn as a histogram. Choose how many price ranges (bins) you want. Simulate the distribution tens of thousands of times over historical candles, and project the range. That includes a copy in the next timeframe period.
Features
Simulated Distribution Histogram
Set how many random samples to simulate. More samples sharpen accuracy. If raising the count changes nothing, stop raising it.
Probability Lines
Type a probability as a decimal from 0.001 to 0.999. The indicator draws a line at that price. Defaults: 1, 25, 50, 75, 99.
Next Period's Range
Shows a copy of the indicator in the next timeframe period. Bar offset and length multiplier cover halted or shortened sessions.
Peak, Location & Density Highlights
Peak Highlights mark the highest-probability bins. Location Highlight finds the bin holding the Data Source's current value. Density Highlights recolor bins where two adjacent bins combine past 8% (high) or sit under the low threshold.
Auto Timeframe + Auto Lookback
Starts drawing at the beginning of the selected timeframe. Auto Lookback uses the maximum number of historical bars the indicator can load. The exact count shows in the TradingView Data Window.
Smoothing Controls That Prevent Overfitting
Probability smoothing and regularization, automatic per data type. A reseedable Seed input for reproducible results.