Indicators
Technical and statistical indicators for TradingView
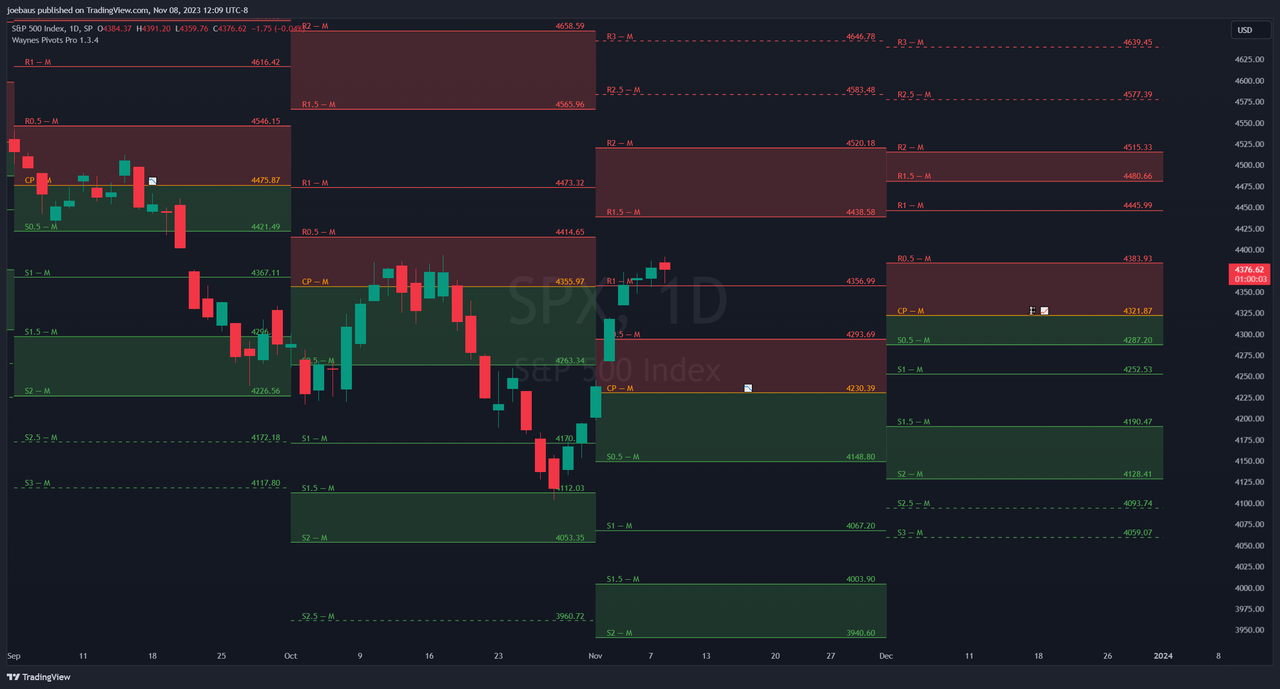
Wayne's Pivots Pro
Pivot points with midpoint levels. Bias strategies included. Next-period forecasting built in.
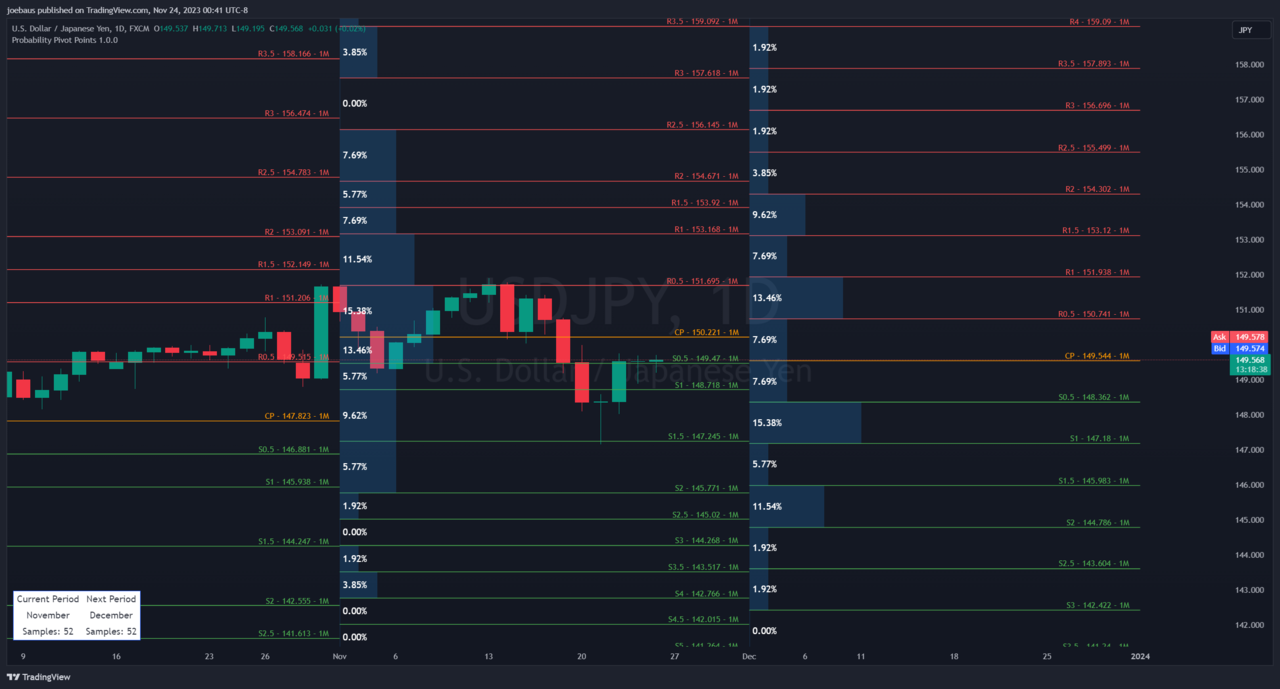
Probability Pivot Points
Custom pivot points with conditional probabilities drawn from historical occurrences.
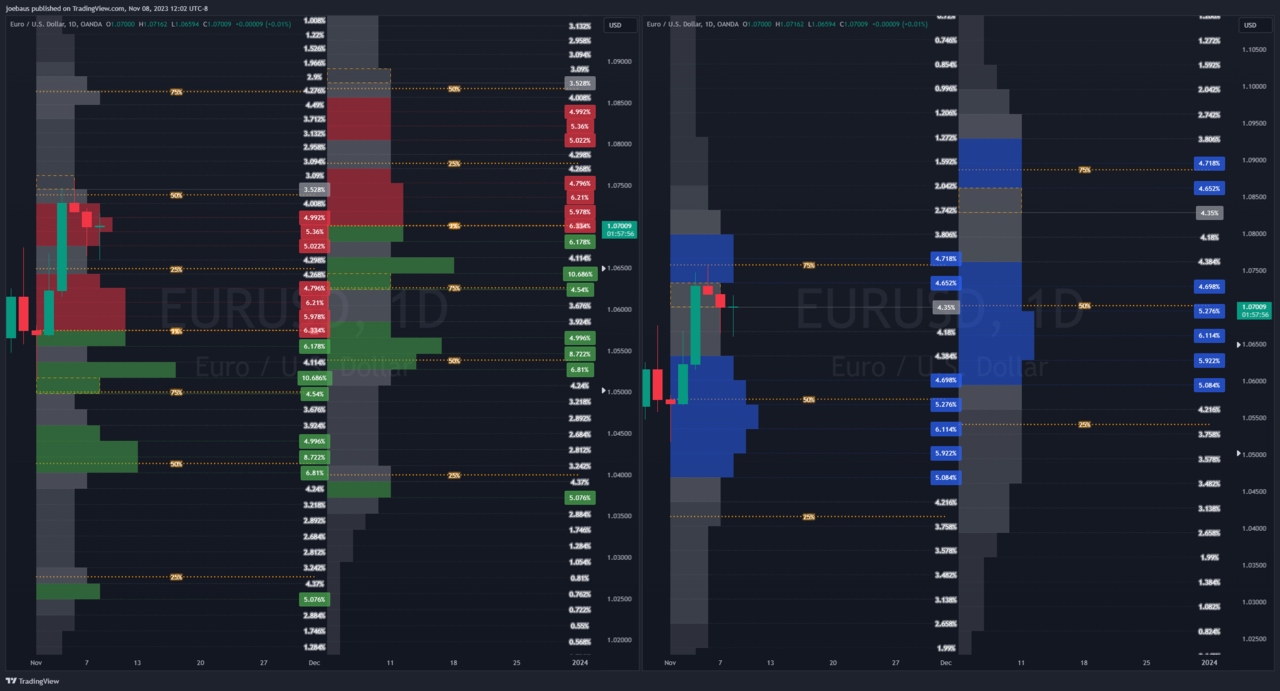
Range Probabilities
Simulate tens of thousands of samples from historical data. Read the likely range off a histogram, with probability lines and a next-period projection.
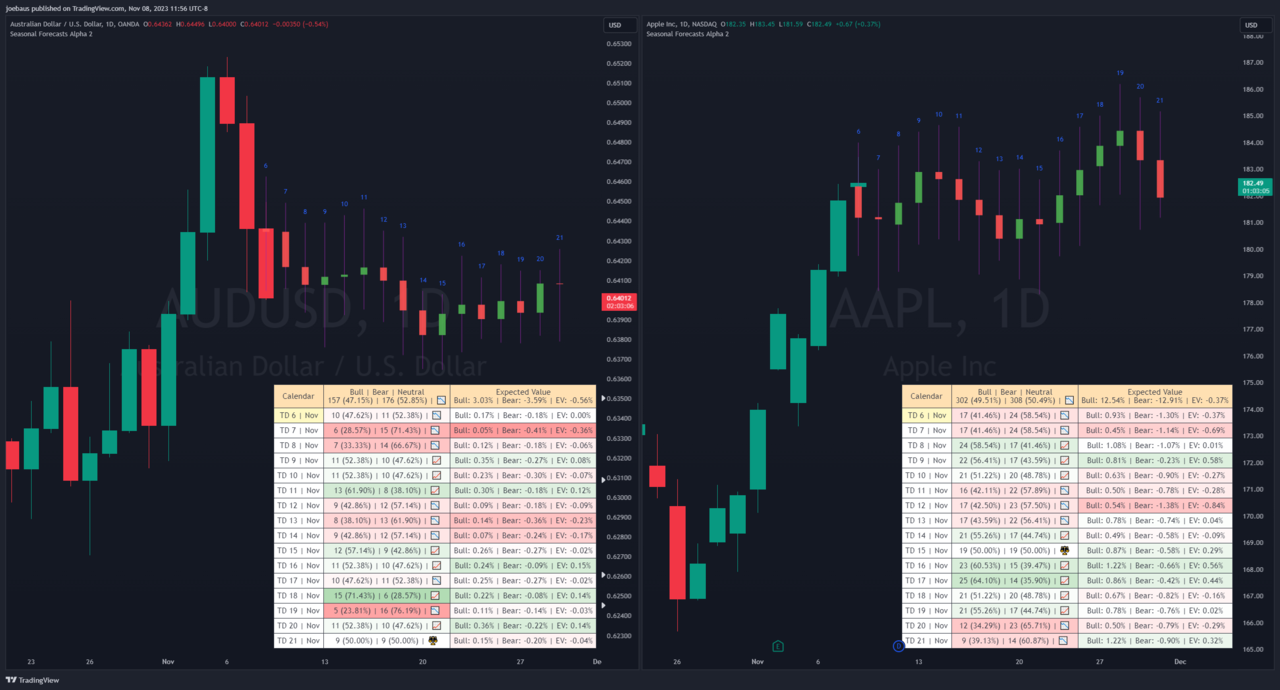
Seasonal Forecasts
A seasonal dashboard plus ghost bars showing the market's usual path. Filterable by year. Loadable with your own data.
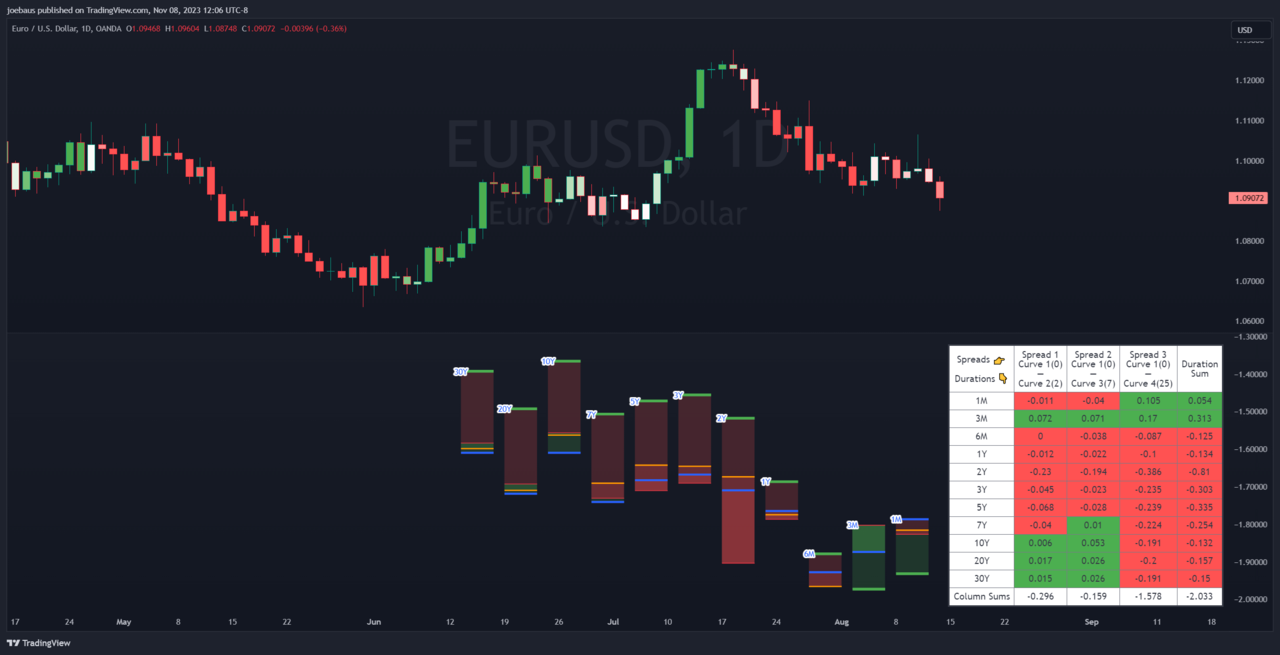
FX Yield Spread Curve
Base-minus-quote yield curves for 10 FX currencies. Spread tables. Alerts. Candle coloring.
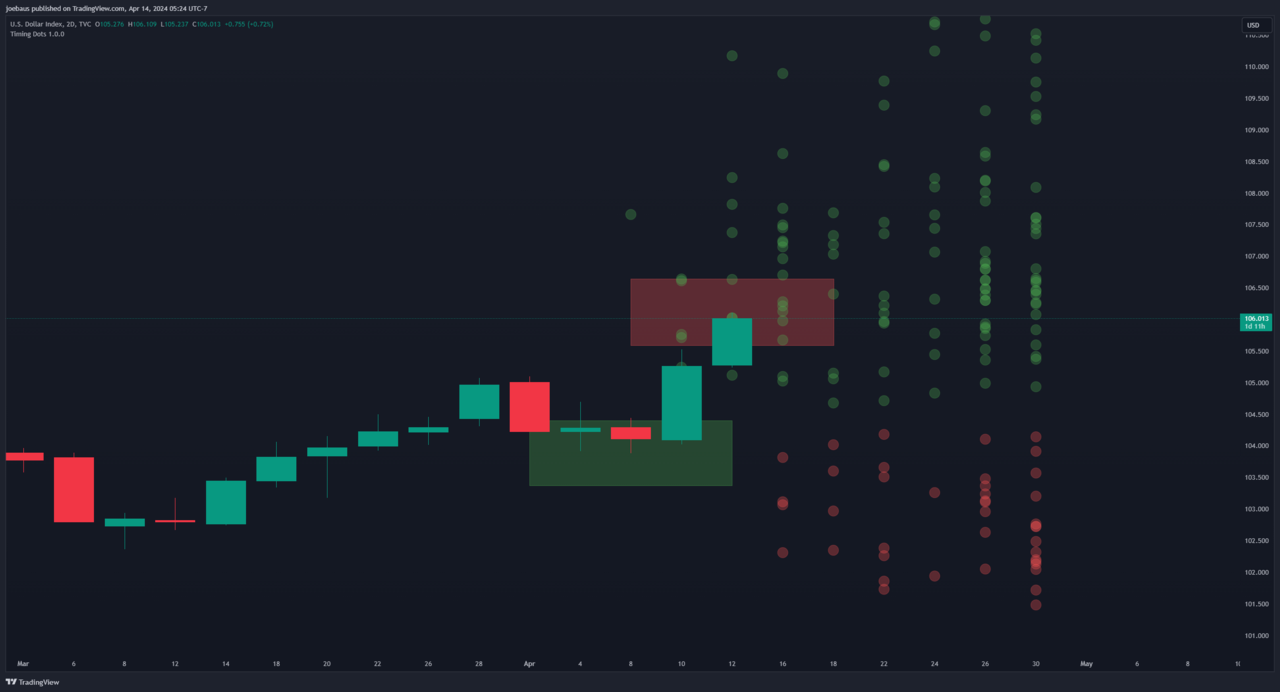
Timing Dots
See where similar historical highs and lows occurred, conditional on the current high and low. A risk-awareness tool, not a signal.
Probability Cones
Forecast Standard or Laplace distributions from any point in time. Free and open-source.
Wayne's Pivots
The public version of Wayne's Pivots with next-period forecasting and midpoint levels. Free and open-source.
Baus Bands
Green and red trend clouds plus a blue 21-EMA ATR band. Free and open-source.
Double Moving Average
Damp choppy whipsaws with double smoothing. Free and open-source.