Seasonal Forecasts
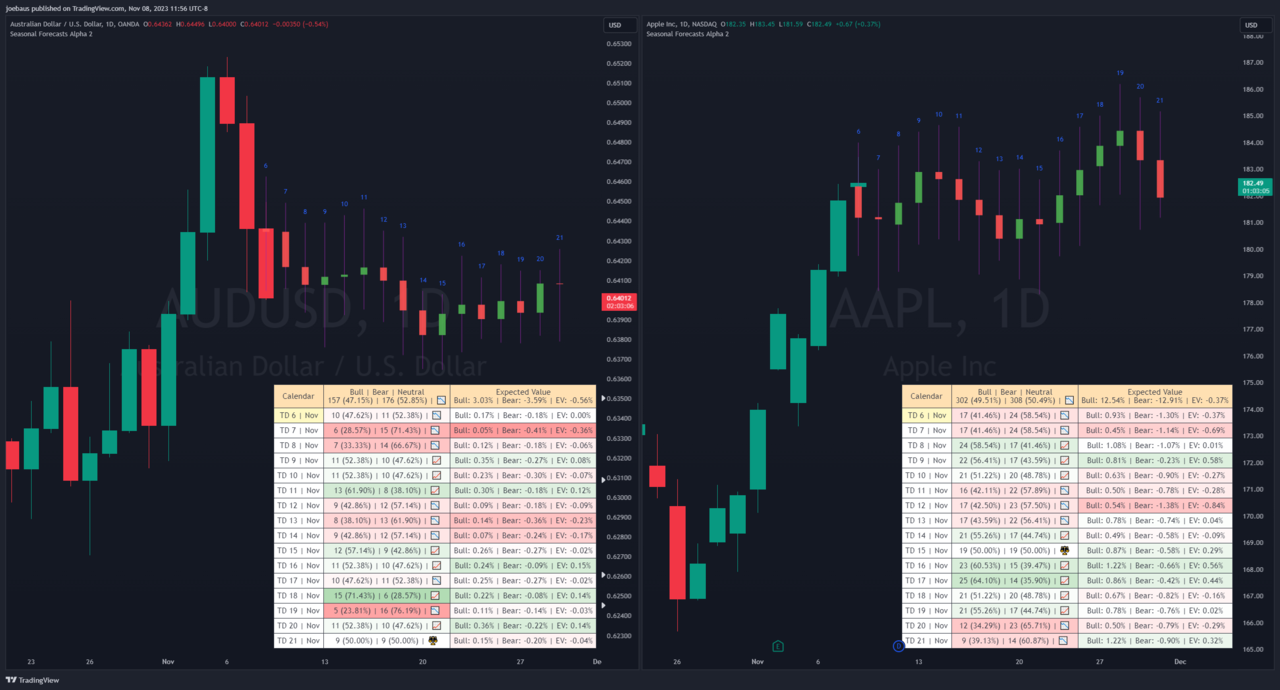
An upgrade of the Seasonal Statistics Dashboard. It gathers seasonal stats for the period ahead. How often it runs bullish or bearish. The expected value. How strong the seasonal signal usually is. Ghost bars draw the mean seasonal OHLC path ahead. Load your own custom data. Filter which years to sample. Style every cell.
Features
Seasonal Dashboard
Stats about the period ahead: bullish and bearish frequency, expected value, and typical seasonal-signal strength. The Seasonal Strength column stays off by default. Turn it on when you want it.
Ghost Bars
The mean seasonal OHLC path for the period ahead, drawn translucent so it stands apart from real bars. The mean switches between average and median.
Year Filter
Sample only years that match current conditions. Pick a range. Cut off before or after a year. Or pass arbitrary include and exclude lists.
Custom Data + Audit Table
Load your own series for seasonal output. Data Table Options let you audit the summary data. Or verify how custom data loads.
Automatic Rolling Period
The analysis window rolls forward on its own as new periods complete. No manual resets.
Full Style Control
Every cell, ghost bar, and text element takes custom color, transparency, and size. Dashboard text defaults to automatic sizing.