Timing Dots
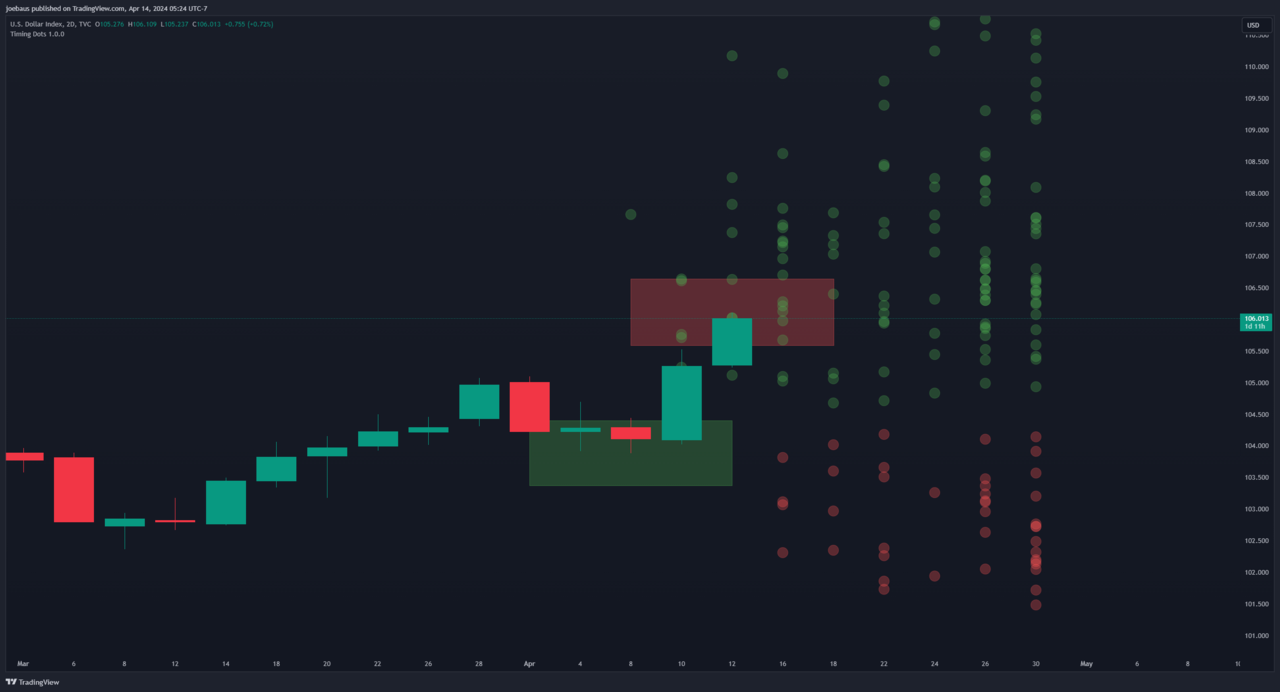
Timing Dots plots historical highs and lows as dots, conditional on the current high and low. It is a risk-awareness tool. Not a signal. It shows when and where similar historical periods topped or bottomed out.
Features
Conditional High Dots
High dots show past highs that followed lows like the current low. Similar price. Similar time.
Conditional Low Dots
Low dots show past lows that followed highs like the current high. Similar price. Similar time.
Adjustable Search Bound Boxes
Two boxes define what counts as similar. Percent Bounds (default 0.1): the percentage above and below the current period's high and low. Bar Bounds (default 1): bars left and right for timing similarity. Widen the boxes for more dots. Narrow them for fewer.
Automatic Higher Timeframe + Override
The higher timeframe follows the chart's timeframe on its own, through threshold-to-target pairs you can customize. Or switch Auto Timeframe off and pick one by hand.
Close Lines + Offsets
A straight line runs from each dot to its close at the end of the timeframe. Close Line Offset (default 0). Only Future Highs and Only Future Lows filters.
Full Style Control
Set the color and style of every dot, box, and line.