Walkthroughs / Probability Cones
Probability Cones — walkthrough
Contents
What it is
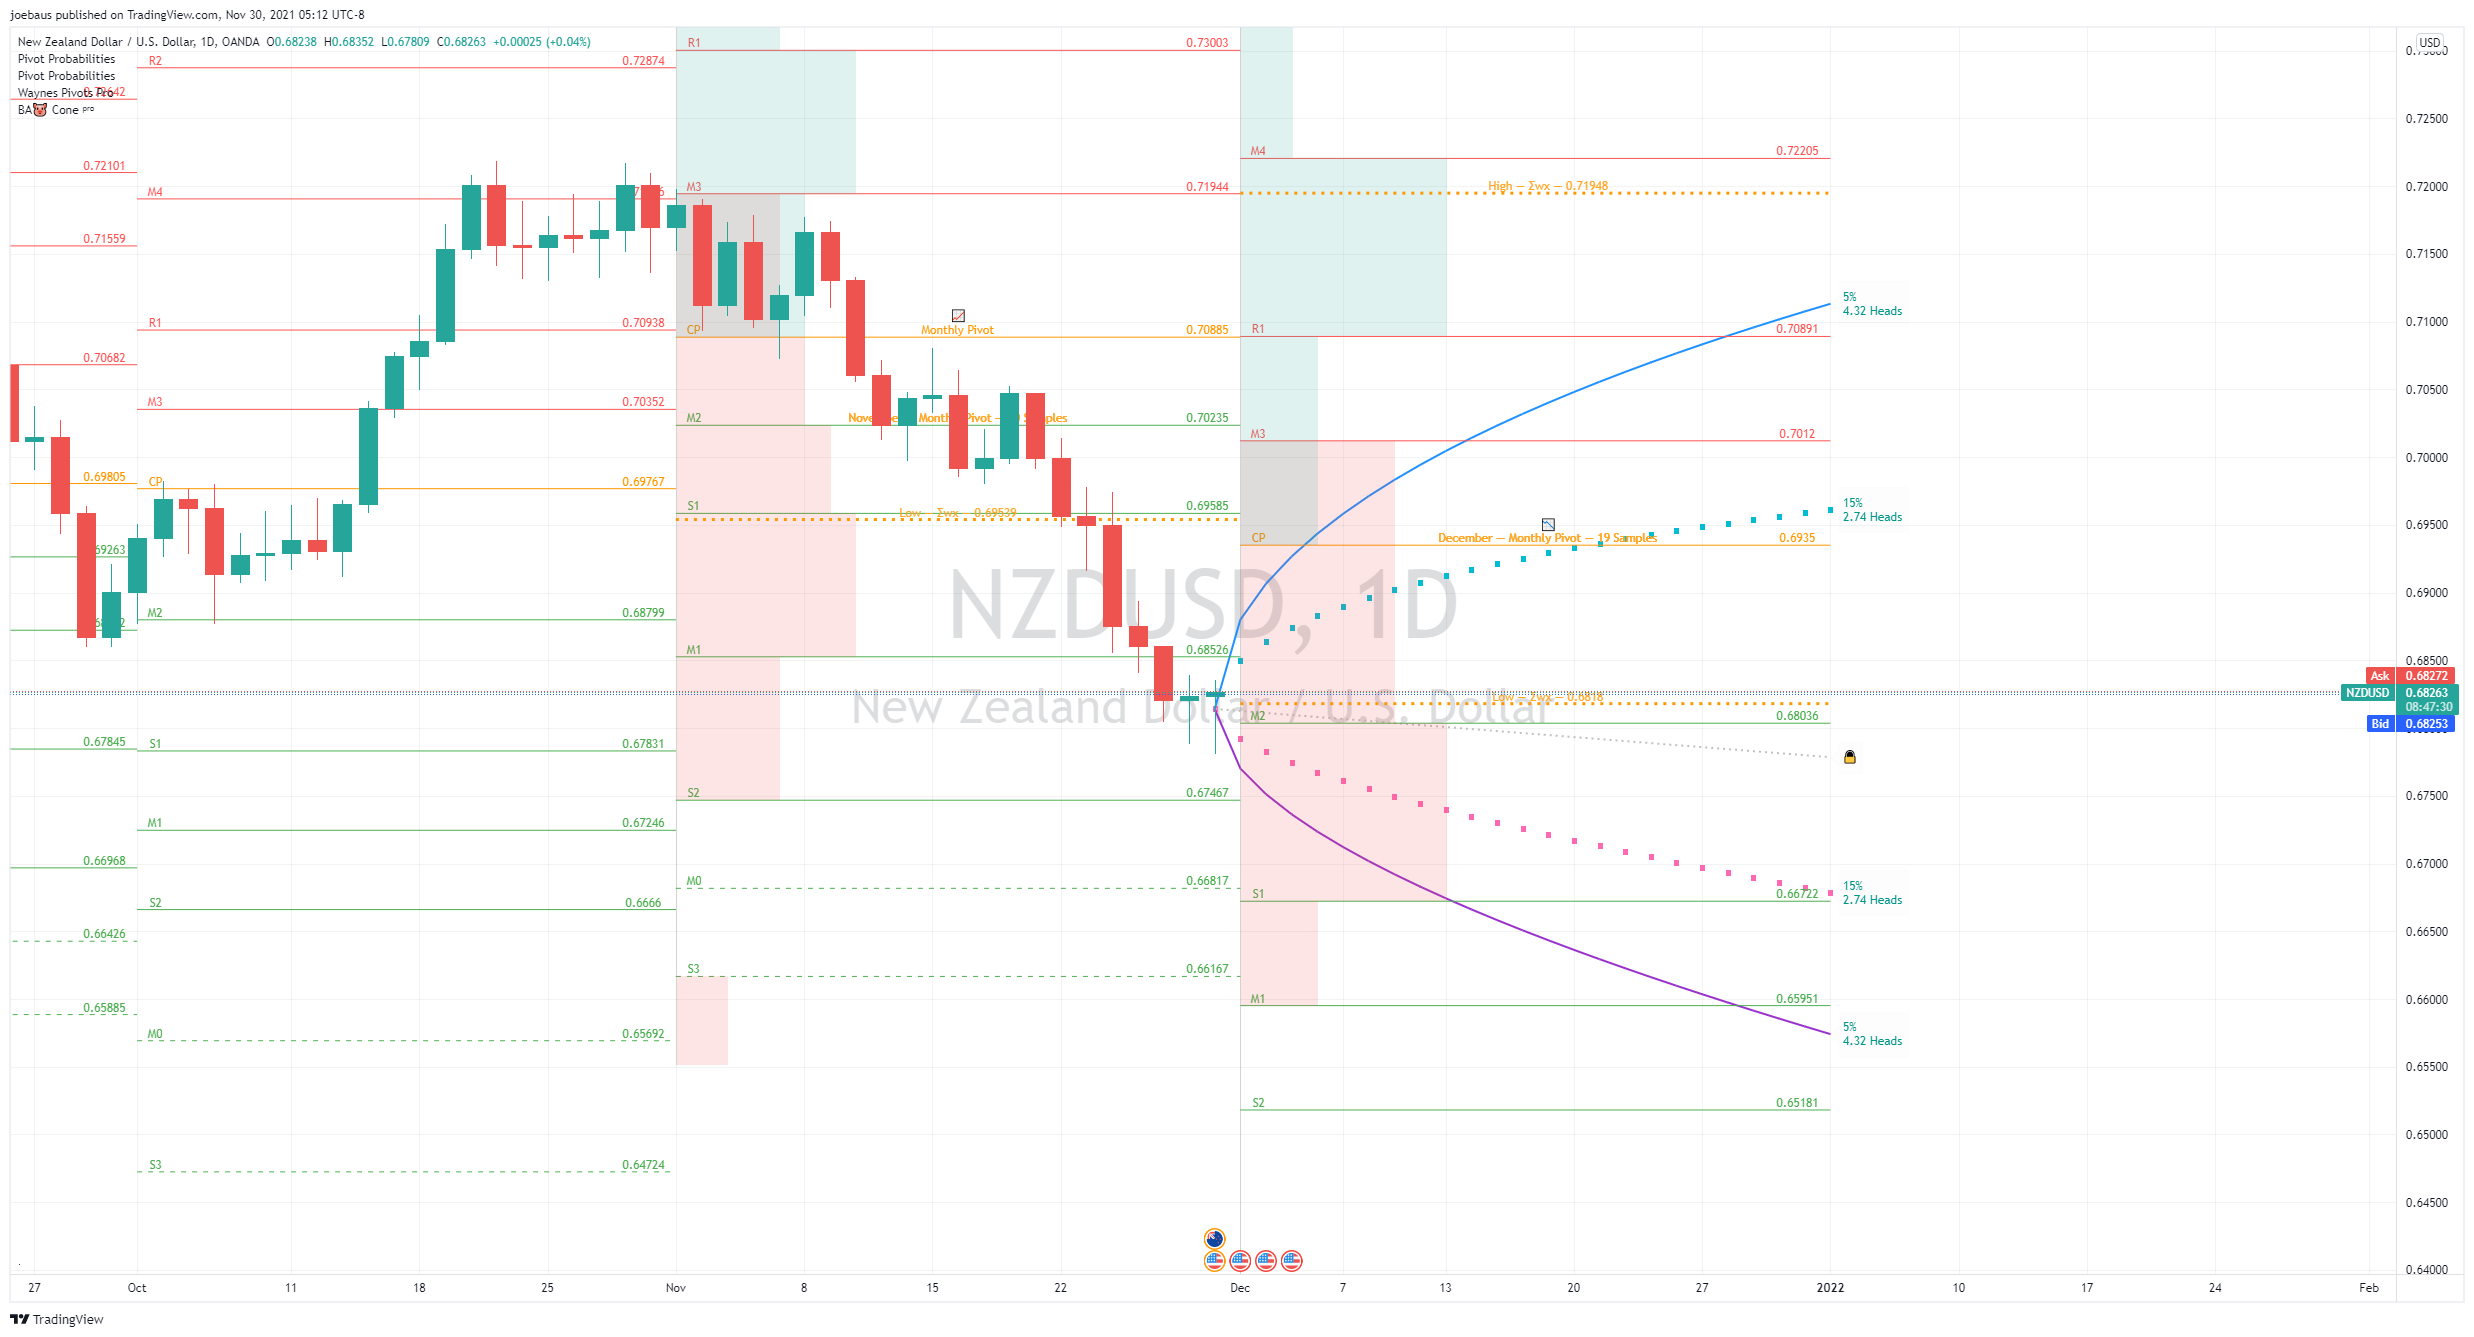
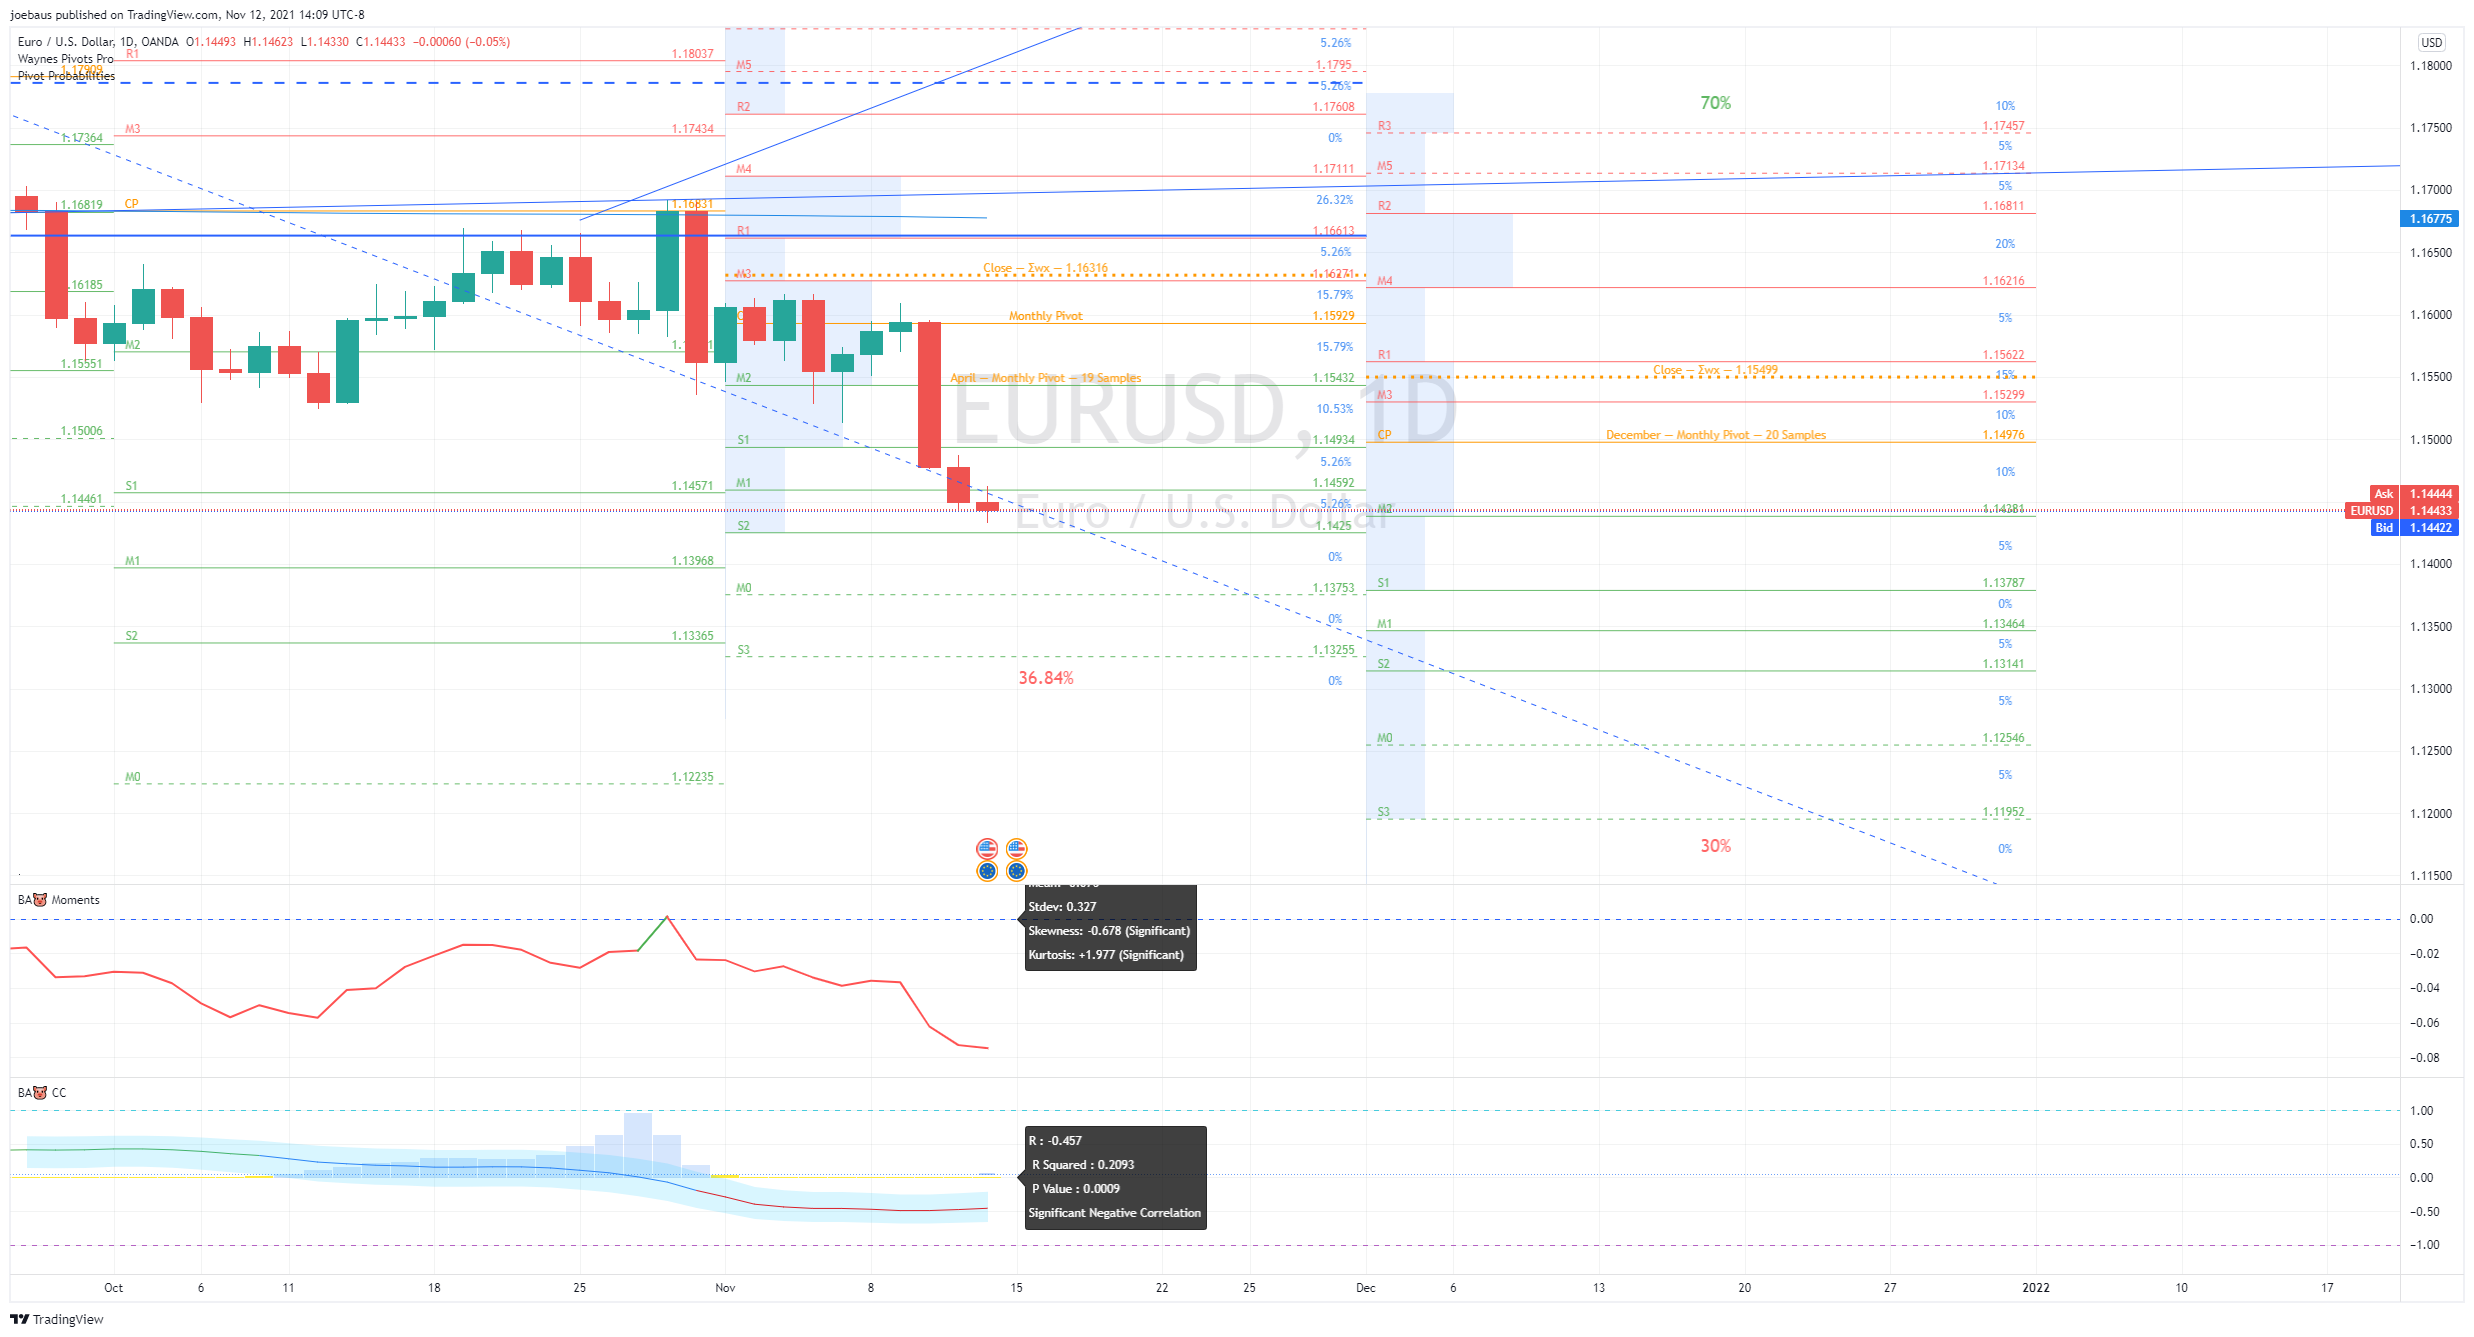
A probability cone is an indicator that forecasts a statistical distribution from a set point in time into the future.
Features
- Forecast a Standard or Laplace distribution.
- Change how many bars the cones will lookback and sample in their calculations.
- Set how many bars to forecast the cones.
- Let the cones follow price from a set number of bars back.
- Anchor the cones and they will not update from their last location.
- Show or hide any set of cones.
- Change the deviation used of any cone's upper or lower line.
- Change any line's color, style, or width.
- Change or toggle the fill colors between any two cone lines.
How to read the cones (corrected interpretation)
- There is an assumption that the distribution starting from the cone's origin, based on the number of historical bars sampled, is likely to represent the distribution of future price.
- Price typically hangs around the mean.
- Strong momentum above or below the first deviation can indicate a trend where price maintains itself past the first deviation. Use a momentum indicator alongside the cones for this reason.
- There is no mean reversion assumption when price deviates. Price can continue to stay deviated.
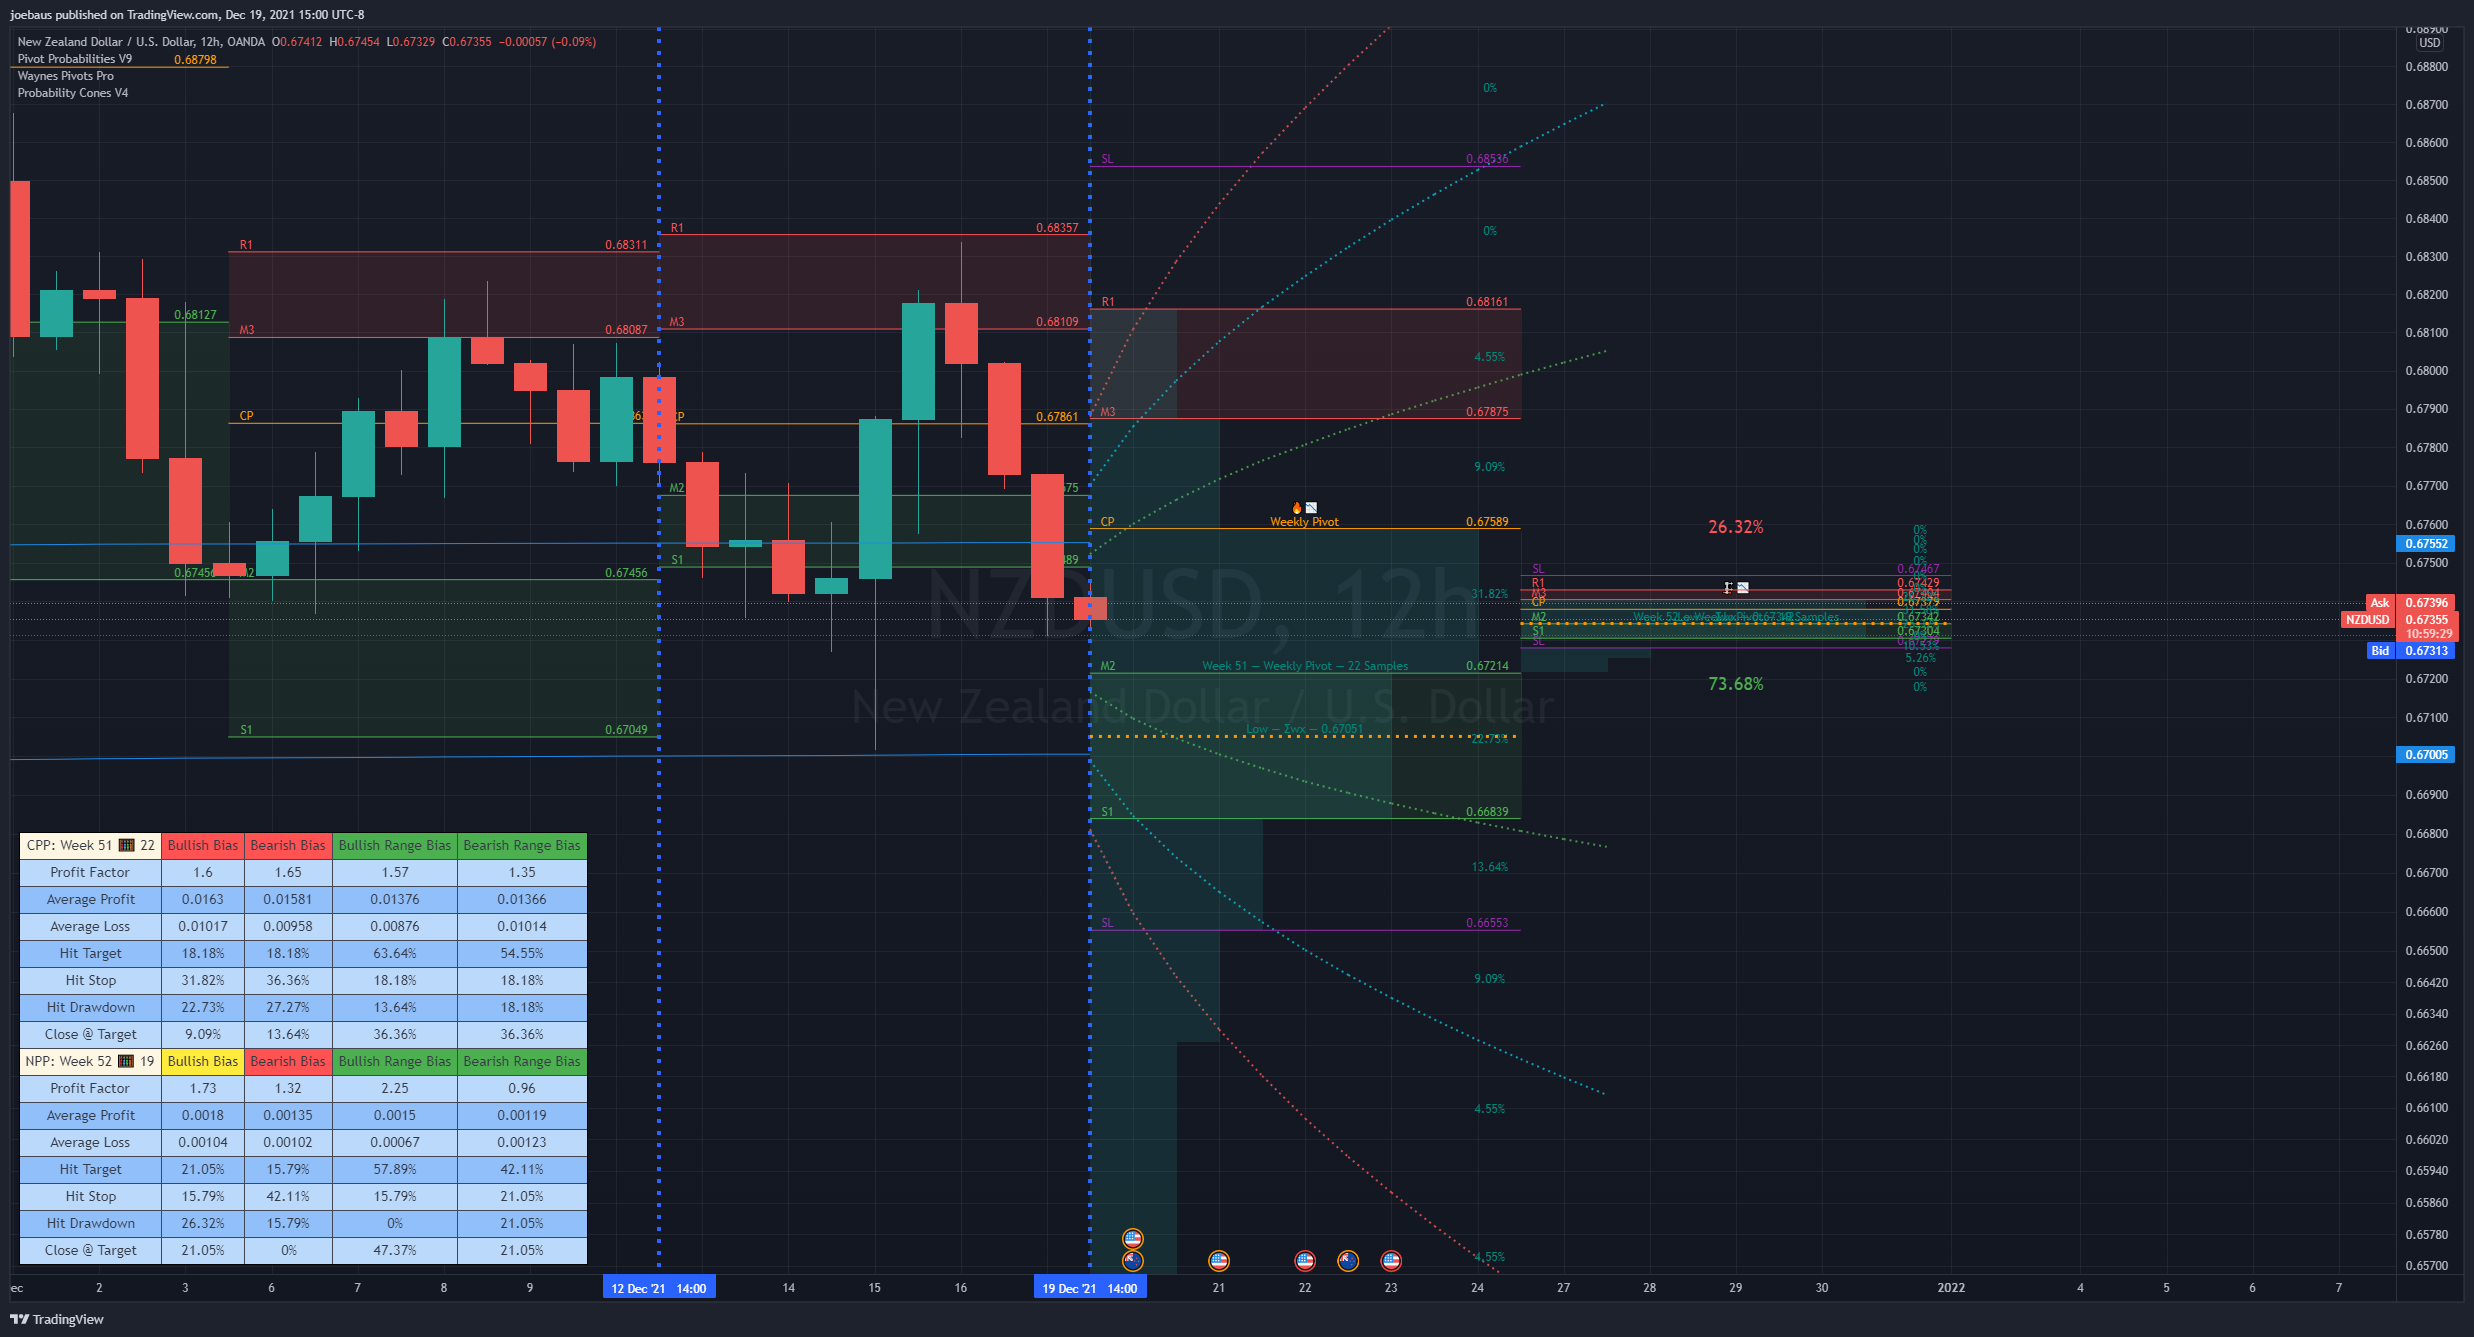
- Place cones at the beginning of calendar periods: the month, week, or day.
- Be mindful on various timeframes: the lookback setting loads its number of bars back from the cone's origin based on the current timeframe.
Correction note (read this before trusting old copies)
Two lines you may meet in old copies are wrong. The 68-95-99.7 rule does not apply here. It governs log returns, not price. And there is no higher reversal probability between the first and second deviation. No mean reversion is assumed anywhere, and deviated price can stay deviated.
Related cleanup: Distributions became Deviations, because no statistical distributions are calculated. Each cone line is a multiple of the selected deviation above and below the mean. The Laplace setting was clarified and an Absolute (Mean Absolute Deviation) option added.
Second Deviation Strategy
How to react when price goes beyond the second deviation is contingent on your trading position.
- Holding a losing trade past the second deviation: it could be time to stop trading and exit.
- Holding a winning trade past the second deviation: look at exit strategies to capitalize on the outperformance.
- No position past the second deviation: do not open any new trades.
Use cones to time exits, not reversals: once price moves outside the confidence level, the forecast is invalidated — exit or scale out.
Anchoring
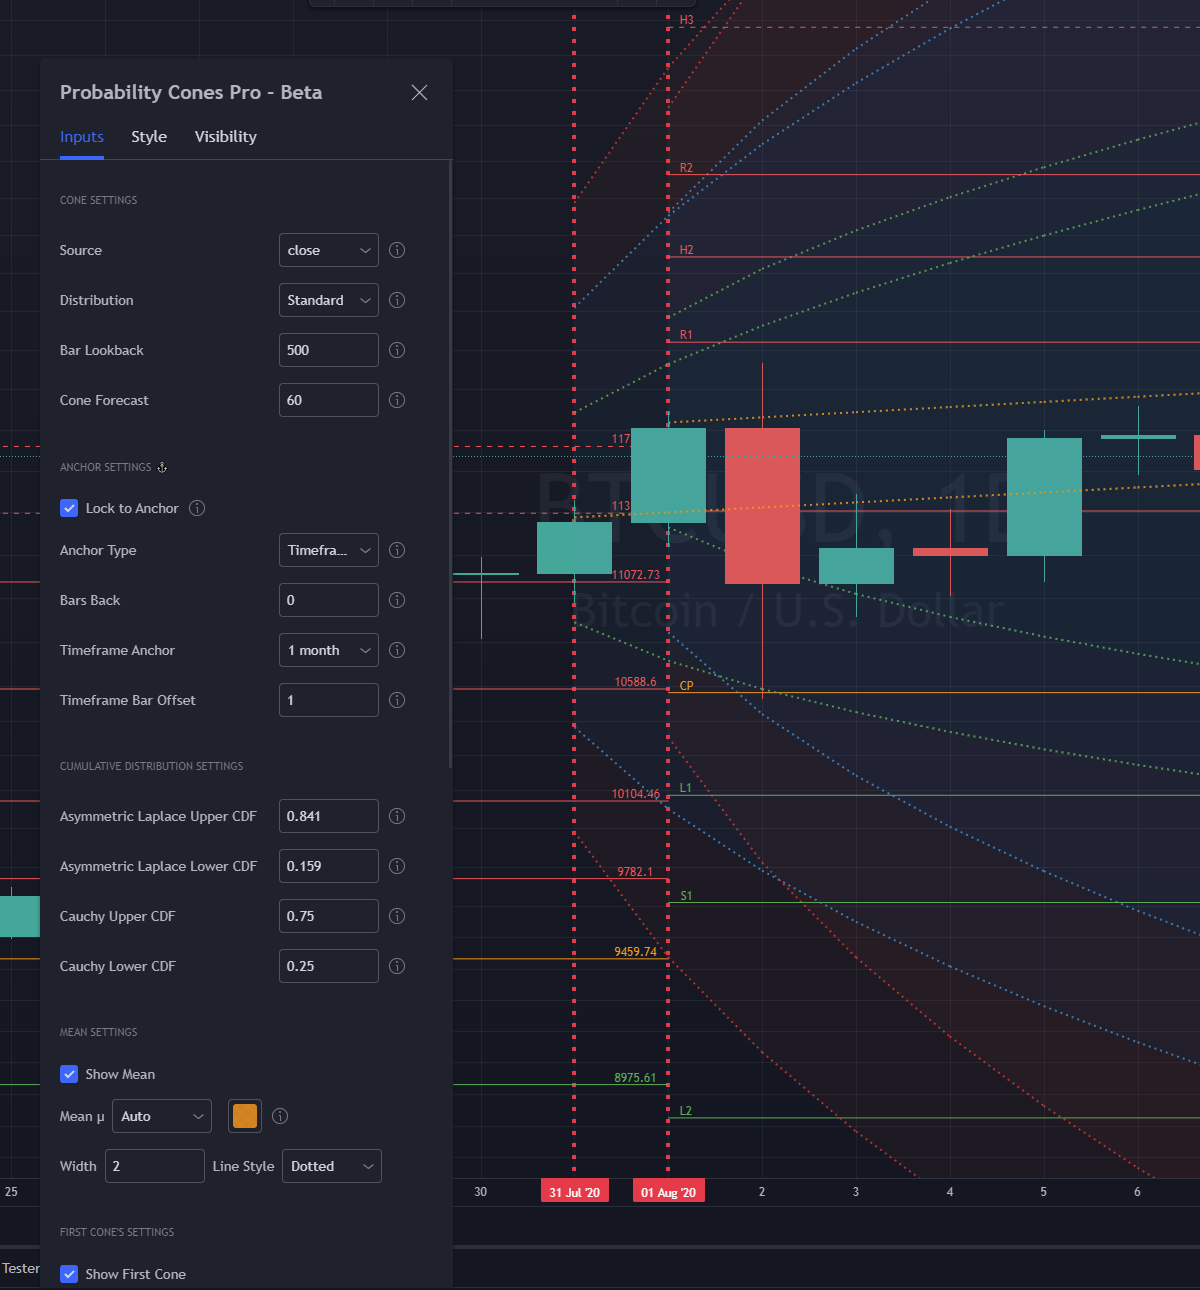
- Anchor types: bars-back, date select (Date Anchor), higher timeframe (HTF Anchor).
- Anchor Offset keeps the cone's anchor out of sample of the forecast period, since a volatile first candle otherwise skews spread and direction.
- Open Anchor toggles including/excluding the anchor bar in the volatility calculation.
- Use Mean Drift adds/removes drift from the mean's increasing/decreasing value in the future.
Related: automated anchoring. Pick a higher timeframe and cones auto-draw from that timeframe's start. The Timeframe Bar Offset then nudges the anchor between day-before and within-period placement.
Lineage
Predecessor chain: Pivot Probabilities → Seasonal Stats Dashboard → Probability Pivot Points and Range Probabilities. The archived cone channels are the origin story of the whole probability line.
Chart examples (Joe's charts)